
Peak検出とは
データ解析においてピーク検出は重要である。物質の特性や反応の挙動を深く理解することができ、例えば、
分光分析では特定の波長における光の吸収や放出がピークとして現われます。
ピーク検出する必要があるのは、
- 1次元の光のスペクトル中の輝線や吸収線を検出したい
- FFTした周波数信号の共振ピークを検出したい
- 時系列データの山や谷を捉えたい
Peakの特徴量
現実的には、ピークが何個もある場合や、見誤りやすいノイズが含まれていて真の信号と弁別したい場合がある。
そういう場合は、ピークの特徴量を使って弁別します。
ピークを特徴づける量として、ピークの
- 高さ
- 位置
- 幅
- 非対称度
- 前後のピークの間隔
ピークを弁別することが出来る。出来るとは言ったものの、ピーク検出や特徴量を算出するには前処理として
ノイズ処理等を行うことが必要であることも忘れてはならない。今回は前処理については詳しくは述べない。
では、早速ピーク検出を行ってみよう。
1.Python(Find_Peaks)でPeak検出
Peak検出方法として、PythonでFind_Peaksを用いるのが非常に簡単で
以下、実際にPythonでFind_Peaksを用いてPeakDetectionを行った場合の結果を以下に示す。
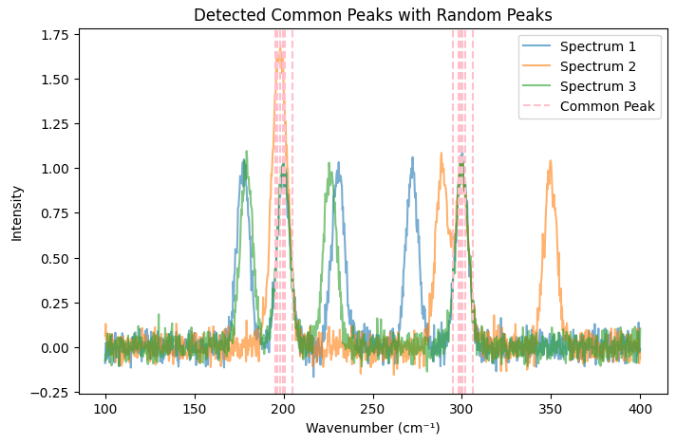
今回はスペクトル1~3までの3本のスペクトルのうち200と300cm-1に共通のピークがあり、その他の波数に
ランダムなノイズピークがあるとする。今回は3本のスペクトルに共通のピークが検出出来るか
Find_Peaksを使ってできるか確認を行った。以下のグラフが結果である。
3本のスペクトル(青/黄/緑)と、共通ピークとして検出された波数がピンクとして縦線で表示されている。
共通ピークで検出された波数の位置を確認すると200と300cm-1に集中しておりある程度うまく検出されている。

import numpy as np
import scipy.signal as signal
import matplotlib.pyplot as plt
# 波数範囲(例: 100-400 cm⁻¹)
x = np.linspace(100, 400, 1000)
# 共通して出るピークの位置
common_peaks_true = [200, 300]
# 各スペクトルのデータを作成
spectra = []
peak_positions = []
for i in range(3):
# 共通ピークの生成
spectrum = sum(np.exp(-((x - p) / 5)**2) for p in common_peaks_true)
# 各スペクトルごとに異なるランダムピークを追加
num_random_peaks = np.random.randint(2, 5) # ランダムピークの数
random_peaks = np.random.uniform(150, 350, num_random_peaks) # 150-350 cm⁻¹の範囲にランダム配置
spectrum += sum(np.exp(-((x - p) / 5)**2) for p in random_peaks)
# ランダムなノイズを追加
spectrum += np.random.normal(0, 0.05, len(x))
# ピーク検出
peaks, _ = signal.find_peaks(spectrum, height=0.2)
peak_positions.append(x[peaks])
spectra.append(spectrum)
# 共通ピークの検出(±1 cm⁻¹ の範囲で一致するピークを抽出)
tolerance = 0.6
common_peaks_detected = set(peak_positions[0])
for peaks in peak_positions[1:]:
common_peaks_detected = {p for p in common_peaks_detected if any(abs(p - q) < tolerance for q in peaks)}
# 結果のプロット
plt.figure(figsize=(8, 5))
for i, spectrum in enumerate(spectra):
plt.plot(x, spectrum, alpha=0.6, label=f"Spectrum {i+1}")
# 共通ピークを強調表示
for p in common_peaks_detected:
plt.axvline(p, color='pink', linestyle='--', label="Common Peak" if p == list(common_peaks_detected)[0] else "")
plt.legend()
plt.xlabel("Wavenumber (cm⁻¹)")
plt.ylabel("Intensity")
plt.title("Detected Common Peaks with Random Peaks")
plt.show()
print("共通ピークの位置:", sorted(common_peaks_detected))
2.Python(Find_Peaksを使わない)でPeak検出
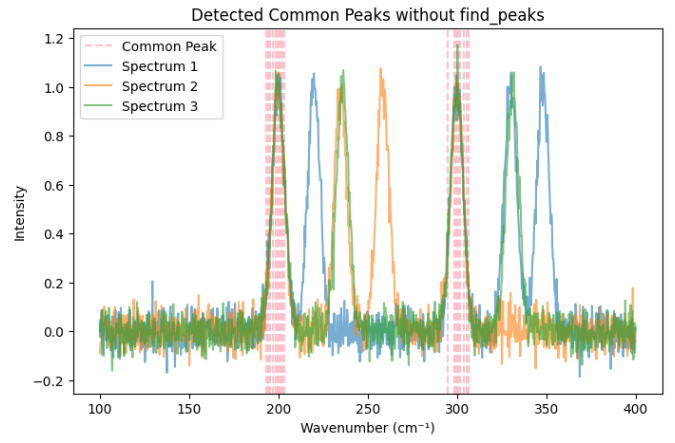
Find_Peaksを使わない場合、ピーク検出は1次微分係数の符号が変化する場所で、かつ、信号量の閾値が0.2より
大きい場所をピーク位置とするとしています。この方式で共通ピークを検出した結果を下にグラフで示しています。
200/300cm-1付近で正しく共通ピークを検出出来ている

###Find_Peakを使わない
import numpy as np
import matplotlib.pyplot as plt
# 波数範囲(例: 100-400 cm⁻¹)
x = np.linspace(100, 400, 1000)
# 共通して出るピークの位置
common_peaks_true = [200, 300]
# 各スペクトルのデータを作成
spectra = []
peak_positions = []
for i in range(3):
# 共通ピークの生成
spectrum = sum(np.exp(-((x - p) / 5)**2) for p in common_peaks_true)
# 各スペクトルごとに異なるランダムピークを追加
num_random_peaks = np.random.randint(2, 5) # ランダムピークの数
random_peaks = np.random.uniform(150, 350, num_random_peaks) # 150-350 cm⁻¹の範囲にランダム配置
spectrum += sum(np.exp(-((x - p) / 5)**2) for p in random_peaks)
# ランダムなノイズを追加
spectrum += np.random.normal(0, 0.05, len(x))
# 1次微分を計算
dy = np.diff(spectrum) # y の差分
dx = np.diff(x) # x の差分
slope = dy / dx # 微分値
# ピーク検出 (符号が + → - に変化する場所)
peak_indices = np.where((slope[:-1] > 0) & (slope[1:] < 0))[0] + 1 # +1 で元の配列に戻す
# しきい値(高さ)でフィルタリング
height_threshold = 0.2
peak_indices = [idx for idx in peak_indices if spectrum[idx] > height_threshold]
peak_positions.append(x[peak_indices])
spectra.append(spectrum)
# 共通ピークの検出(±1 cm⁻¹ の範囲で一致するピークを抽出)
tolerance = 1.0
common_peaks_detected = set(peak_positions[0])
for peaks in peak_positions[1:]:
common_peaks_detected = {p for p in common_peaks_detected if any(abs(p - q) < tolerance for q in peaks)}
# 共通ピークを強調表示
plt.figure(figsize=(8, 5))
for p in common_peaks_detected:
plt.axvline(p, color='pink', linestyle='--', label="Common Peak" if p == list(common_peaks_detected)[0] else "")
# 結果のプロット
for i, spectrum in enumerate(spectra):
plt.plot(x, spectrum, alpha=0.6, label=f"Spectrum {i+1}")
plt.legend()
plt.xlabel("Wavenumber (cm⁻¹)")
plt.ylabel("Intensity")
plt.title("Detected Common Peaks without find_peaks")
plt.show()
print("共通ピークの位置:", sorted(common_peaks_detected))
